ABSTRACT
The dielectric and piezoelectric properties of the ferroelectric BaTiO3 were measured and analyzed using both strong and weak electric field conditions. To measure the electric field induced polarizations and strains, a high voltage source and the measuring circuit were used and the dielectric constants were measured with an impedance analyzer. The spontaneous polarization of BaTiO3 at room temperature was calculated as 17 μC/cm2 based on the lattice structure and internal ion location, which is in good agreement with the experimental results. The polarization and strain hysteresis curve according to the electric field were analyzed in terms of lattice structure and ion position. The magnitude of remanent polarization is proportional to the offset distance of Ti4+ ion from the lattice center. The magnitude of dielectric permittivity is proportional to the degree to which Ti4+ ion can move freely inside the lattice. The magnitude of piezoelectric constant d33 is proportional to how much Ti4+ ion distorts the lattice as it moves inside the lattice.
-
KEYWORDS: Ferroelectric, BaTiO3, Polarization, Strain, Piezoelectric, Dielectric
1 Introduction
BaTiO
3 (BT) is one of the most extensively studied ferroelectric materials with a perovskite structure [
1–
5]. BT exhibits a ferroelectric, pyroelectric, and piezoelectric properties which makes it useful in applications such as capacitors, ferroelectric memory devices, and piezoelectric transducers [
6–
8]. BT exists in one of four polymorphs depending on temperature. From low to high temperature, these crystal symmetries are rhombohedral (< -90℃), orthorhombic (-90~0℃), tetragonal (0~120℃) and cubic (> 120℃) structure. All of these phases exhibit the ferroelectric effect except the cubic phase [
2].
In the high temperature cubic phase, all anions and cations are symmetrical with respect to the lattice center point. Lower symmetry phases are stabilized at lower temperatures and involve movement of the Ti
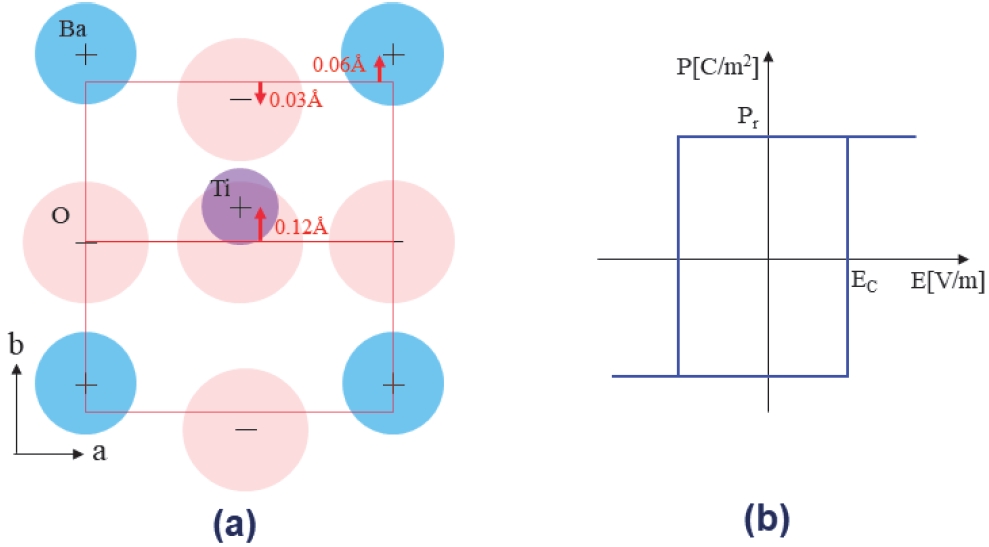
4+ to off-center positions. BT exhibits tetragonal structure at room temperature and the ion positions in BT lattice was reported as shown in the
Fig. 1(a) [
2]. All cations and anions are located at off-center position corresponding to a permanent electric dipole.
Table 1 summarizes the polarization of all cations and anions based on the BT lattice model shown in
Fig. 1(a). The volume of the BT unit cell is 4.03 Å × 3.98 Å × 3.98 Å = 6.38 × 10
-29 m
3, and the total polarization induced in the unit cell is 1.056 × 10
-29 Cm, so the polarization per unit volume is calculated as 1.056 × 10
-29 Cm/6.38 × 10
-29 m
-3 = 17 μC/cm
2. The magnitude of PS in BT has been reported to be about 15~20 μC/cm
2 depending on the process conditions [
1–
3], which is almost in agreement with the value calculated in the present study. When a strong electric field larger than coercive electric field (EC) is applied, Ti
4+ ion moves to an alternative position on the opposite side, which results in the hysteresis of the polarization versus electric field (P-E) loop.
If the two alternative positions of Ti
4+ ion are fixed regardless of the magnitude of the applied electric field, the P-E loop could be simply modeled as shown in
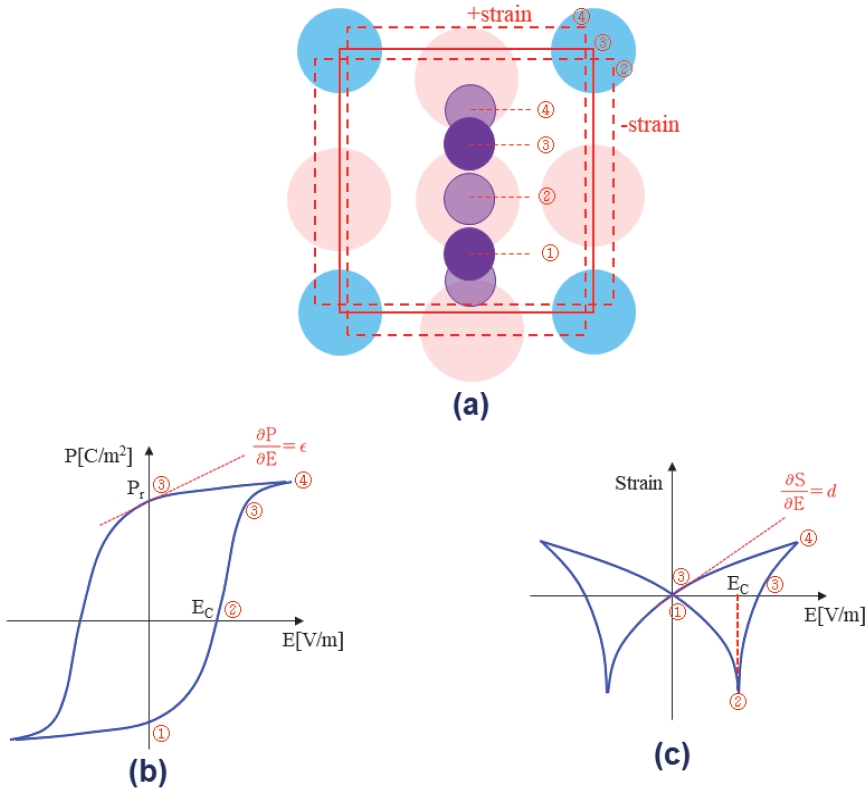
Fig. 1(b). However, when the P-E loop of ferroelectrics is actually measured, it appears in the form shown in
Fig. 2(b). If the applied electric field increases further beyond the EC, Ti
4+ ion move from position ③ to ④ as shown in
Fig. 2(a). Therefore, the polarization increases further. The macroscopic strain of the sample according to the electric field appears in the form shown in
Fig. 2(c). In equilibrium state, Ti
4+ ion is located at one of the two off-center alternative positions (① and ③). No matter where Ti
4+ ion is located, the macroscopic strain will be zero. When the electric field close to the EC is applied, Ti
4+ ion moves to the opposite direction. When it passes through the center point, it pushes the face-center oxygen ions outward, resulting in negative strain as shown by number ② in
Fig. 2(c). If the applied electric field increases further beyond the EC, the Ti
4+ ion move from position ③ to ④. As there is no enough rattling space inside the lattice for the ion to move, the large positive strain occurs due to the lattice distortion.
In this work, the dielectric and piezoelectric properties of BT were studied under large electric field and small electric field condition. Firstly, the electric field induced polarizations and strains of BT were investigated using high voltage source. The dielectric constants were measured using low voltage impedance analyzer. Finally, the dielectric and piezoelectric properties of BT evaluated under the strong and weak electric field conditions were compared and discussed. In BaTiO₃ ferroelectrics, the polarization and strain induced by an applied electric field arise from complex mechanisms involving not only the displacement of the central Ti ion but also domain wall motion. However, in this study, we focus solely on the movement of the Ti ion to analyze the correlation between polarization and strain.
2 Experiments
The BT samples in this study were synthesized using a solid state reaction method in an air atmosphere [
2,
9]. Reagent grade (> 99.0% purity) BaCO
3 and TiO
2 were used as starting materials.
The mixed powders were homogenized by ball milling in ethanol for 24 h using zirconia balls, followed by drying and sieving. The dried powders were calcined at 1,100°C for 3 h in air. The calcined powders were then uniaxially pressed into pellets and sintered at 1,300°C for 2 h in air. The heating rate was controlled at 5°C/min. After sintering, the samples were furnace-cooled to room temperature. The fabricated samples were cut and polished to finally produce 10 mm × 10 mm × 5 mm square type specimen. The samples were poled under a DC electric field of 3 kV/mm at 120°C for 20 min in silicone oil. After poling, the samples were cooled down to room temperature under the applied electric field to stabilize the ferroelectric domains. Au electrodes were sputtered onto the 10 mm × 10 mm faces and the specimens were poled along the 5 mm length.
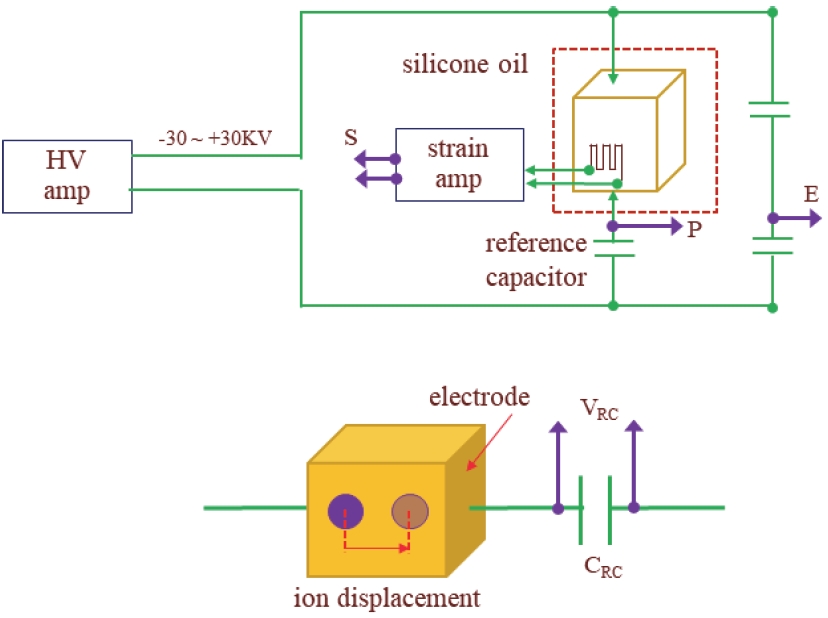
Dielectric constants were measured with an impedance analyzer (4192A, HP). The measuring frequency of 1 kHz and the excitation voltage of 1 V were applied. To measure the electric-field induced polarizations and strains, a high voltage source (+/− 30 KV, 1 Hz, 609 A, Trek) and the measuring circuit were used as shown in
Fig. 3 [
10,
11]. The measuring temperature was controlled in the range of 20~170℃ using a heater and a silicone oil chamber. A strain gauge was attached to the 10 mm × 5 mm vertical face of the sample. The electric field was applied to x3 direction and the dielectric properties were also measured along x3 direction to obtain 33 mode data.
Ferroelectrics have remanent polarization (Pr) inside, and the direction of polarization changes depending on the direction of the external electric field. There is no way to directly measure the magnitude of Pr inside a ferroelectric, and the magnitude and direction of internal polarization can be calculated by measuring the current flowing through the sample. In this study, as shown in
Fig. 3, a reference capacitor was connected in series with the sample. The capacitance of the reference capacitor was set to a value 1,000 times larger than the capacitance of the sample, so it is assumed that all of the applied high voltage was applied to the sample. When the HV source generates a sine wave AC voltage and supplies it to the circuit, the current flowing through the sample (IS) is expressed as follows.
(CS: sample capacitance, V(t): applied voltage, AS: sample area, P: polarization).
If the sample is a paraelectric, the
dPdt term is zero. In this case, the current through the sample is given by
IS(t)=CSdV(t)dt and the voltage across the reference capacitor will be
VRC(t)=1CRC∫IS(t)dt=CSCRCV(t). Therefore, V
RC(t) and V(t) are always in phase and linearly proportional, so the P-E curve appears linear and the hysteresis do not appear. If the sample is a ferroelectric, the magnitude of internal polarization changes according to the applied electric field, the polarization change (
ASdPdt) appears as a current component. In this case, the I
pol current suddenly appears near the coercive electric field, so the P-E curve appears nonlinear and hysteresis appear as shown in
Fig. 2(b).
3 Results and Discussion
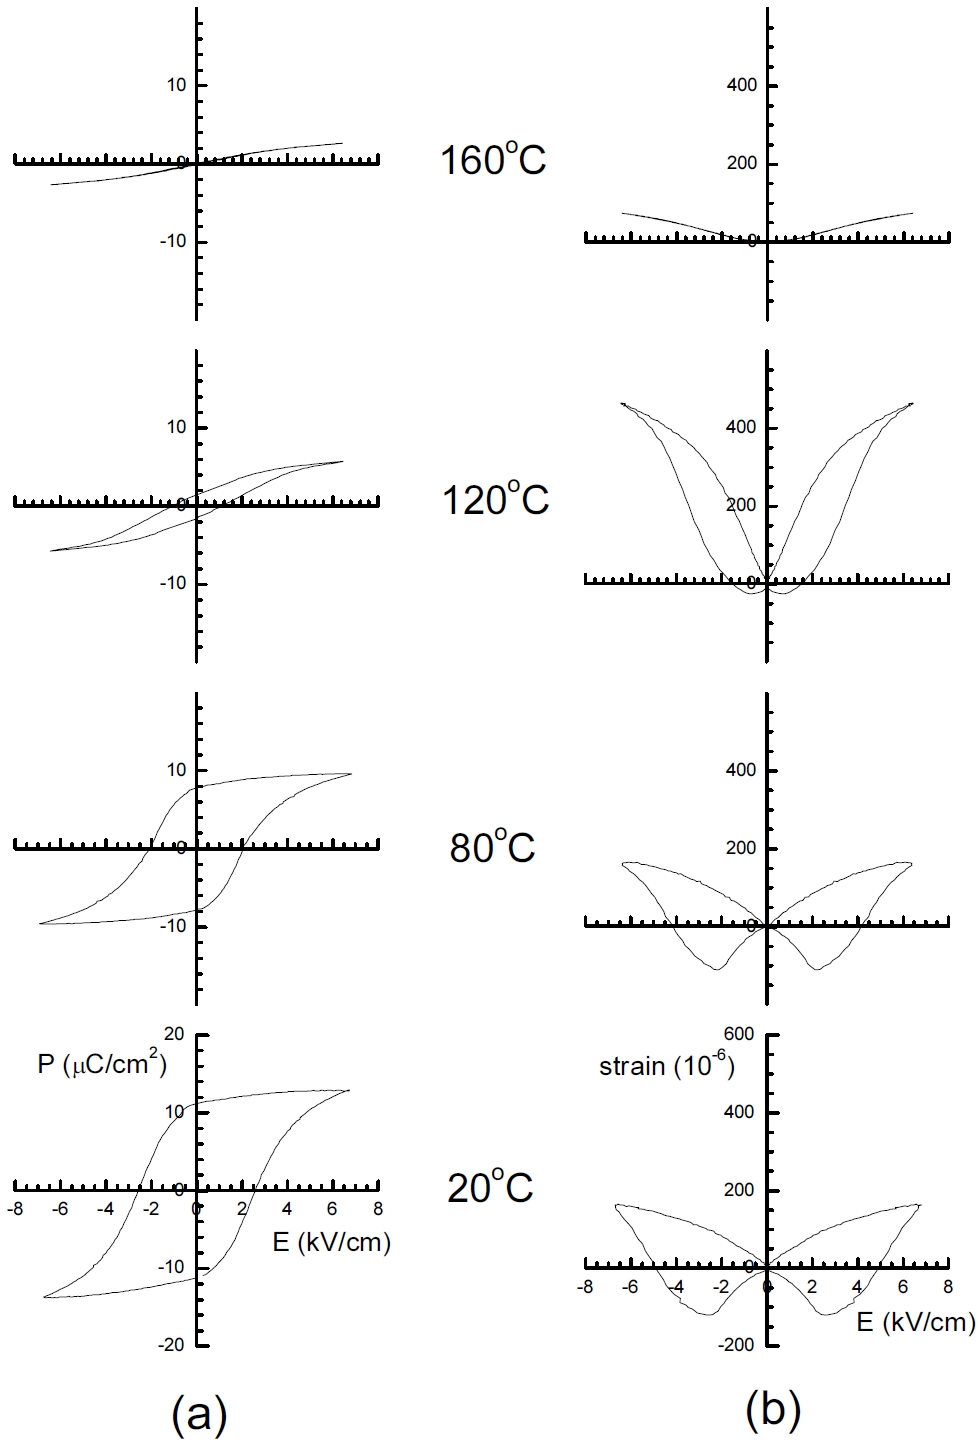
Fig. 4(a) shows the P-E plots in BT at selected temperatures. At 20℃, the P-E plot shows typical ferroelectric behavior. The magnitude of P
r and E
C were 11 μC/cm
2 and 2.5 kV/cm respectively. As the temperature increases above the Curie temperature (T
C, 120℃), both the P
r and E
C decrease significantly. Above the T
C, the P-E plot shows a typical paraelectric behavior.
Fig. 4(b) shows the strain versus electric field (S-E) plots in BT at selected temperatures. Above T
C, the plot shows electrostrictive behavior, that is, the strains are proportional to the square of the electric field, and the magnitudes of the induced strains significantly decrease as the temperature increases above T
C. As the temperature decreases below T
C, the S-E plots become butterfly-shaped, which means ferroelectricity. At 120℃, the induced strain reaches approximately 450 × 10
-6 (0.045%). Since the magnitude of dielectric polarization in ferroelectrics is the product of dielectric permittivity and electric field (P = εE), the slope of the P-E curve is the dielectric permittivity of ferroelectrics
∂P3∂E3=ε33=ε0εr. For example, at 20℃, the observed
∂P∂EE=0 value from the P-E plot is ca. 4 × 10
–8[C/Vm] = 4 × 10
–8[F/m] . Considering ε
0 = 8.85 10
–12[F/m] , the relative dielectric constant (ε
r) is calculated as
εr=4×10⁻⁸[ F/m]8.85×10−12[ F/m]=4,500. Using the same process, ε
r (ε
33/ε
0) values could be calculated at all temperature and the results were summarized at
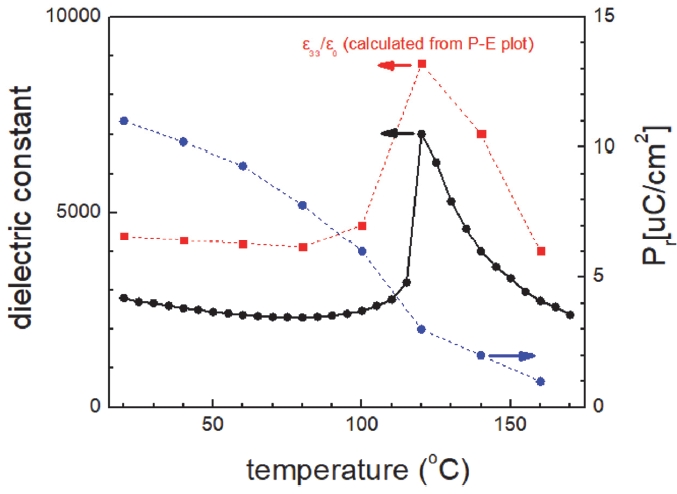
Fig. 5. The temperature dependence of the dielectric constants measured by the impedance analyzer (1 kHz) was also presented at
Fig. 5. The temperature dependence of the dielectric constants measured using two different methods show a similar tendency. The dielectric constant measured by the impedance analyzer near T
C was found to be ca. 7,000, and the value measured in the P-E loop was found to be ca. 9,000. The sharp decrease in dielectric constant above the T
C is due to the cubic and paraelectric properties of BT. The P
r value determined from the P-E loop at 20℃ was ca. 11 μC/cm
2, and gradually decreased as the temperature increased, and then rapidly decreased over the T
C. At 160℃, the Pr value appears to be very low, ca. 1 μC/cm
2.
The correlation between the piezoelectric coefficient (d) and the strain (S) in piezoelectric materials is given as
S = dE, the slope of the S-E curve means piezoelectric constant
∂S3∂E3=d33. For example, at 20℃, the observed
∂S∂EE=0 value from the S-E plot is ca.
30×10−6[1kV/cm]=300[pm/V] , which is similar to the value reported in BT system [
2,
3].
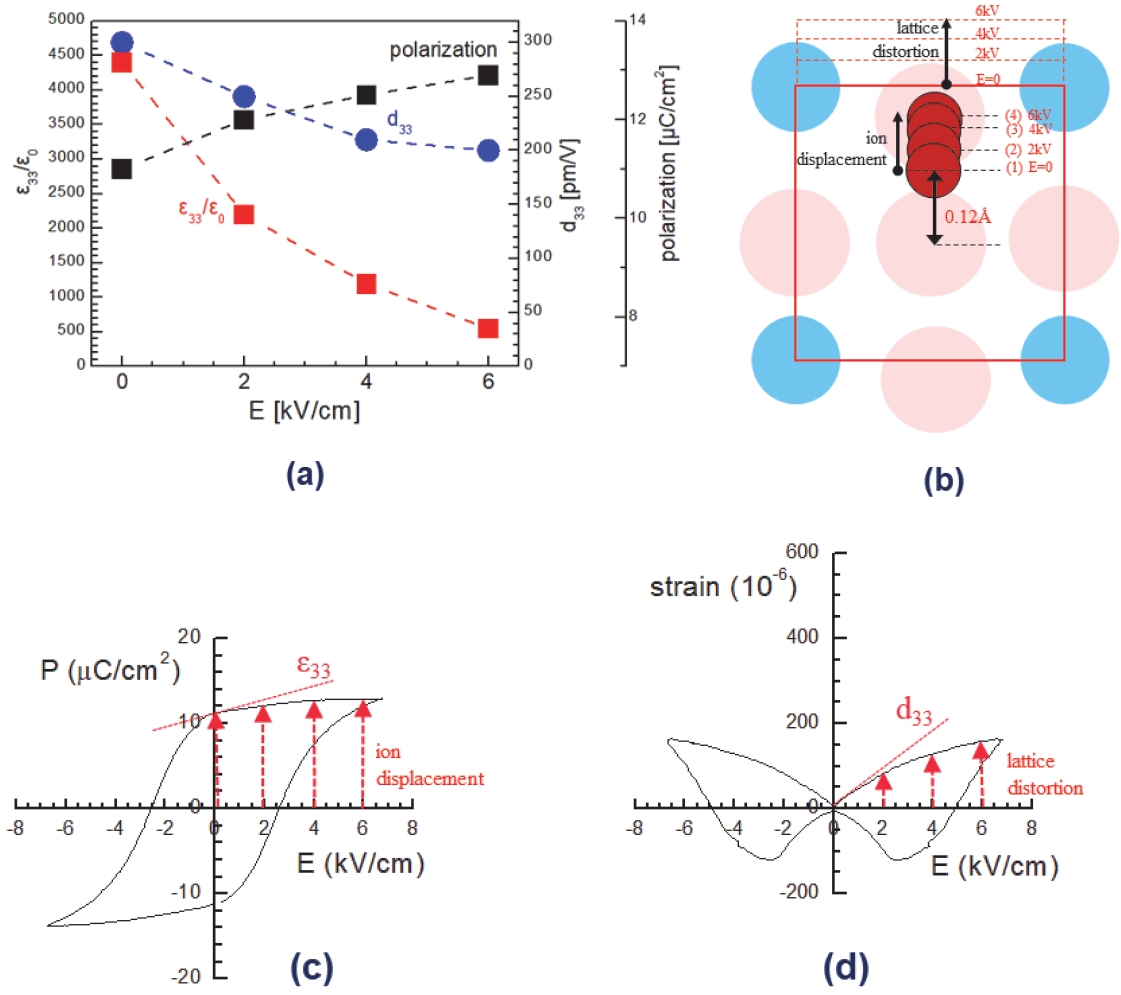
Fig. 6(a) shows the calculated ε
33 and d
33 values from the P-E and S-E plot at 20℃ when the applied electric field was 0, 2, 4 and 6 kV/cm. When the E=0, the Ti ion inside the BT lattice is located as indicated by (1) in
Fig. 6(b) and 0.12 Å away from the center of the lattice. When the applied electric field increases to 2~6 kV/cm, the Ti ion is pushed outward from the center of the lattice. However, Ti ion cannot move proportional to the applied electric field due to the interaction with the other ions of the lattice. Eventually, as the magnitude of the applied electric field increases from 0 to 6 kV/cm the free movement of Ti ions becomes increasingly restricted, which appears to be a decrease in the ε
33 value. The magnitude of ε
r (ε
33/ε
0) decreases from 4,500 to 500 as the magnitude of the applied electric field increases from 0 to 6 kV/cm.
The d33 values calculated from the slope of S-E plot also decrease as the magnitude of the applied electric field increases from 0 to 6 kV/cm. It is noteworthy that the rate of decrease of d33 is lower than that of ε33. As the magnitude of the applied electric field increases from 0 to 6 kV/cm, Ti ions become more and more pushed outward toward the edge of the lattice, and the movement of Ti ions is more and more limited, but the deformation of the lattice becomes relatively larger.
The effect of the applied electric field on the magnitude of polarization induced is summarized in
Fig. 6(c) and
Table 2. The magnitude of the induced polarization at E=0 is 11 μC/cm
2, which means the P
r value. As the magnitude of the applied electric field increases from 0 to 6 kV/cm, the magnitude of the induced polarization increases from 11 to 12.9. It is reported that Ti ion is 0.12 Å away from the center of the lattice when there is no external electric field. The exact position of the Ti ion under an applied electric field remains unclear. However, considering the magnitude of polarization according to the electric field, it can be roughly estimated that the position of Ti ions will move away from the center of the lattice from 0.12 Å to 0.14 Å as shown in
Table 2. As an external electric field is applied, not only Ti ion but also Ba and oxygen ions move inside the lattice, but for simplicity of analysis, it is assumed that only Ti ion moves. When the applied electric field increases from 0 to 2 kV/cm, the displacement of Ti ions increases by 0.01 Å (0.13 Å–0.12 Å), which is about 0.25% compared to the lattice size (4 Å). On the other hand, the applied electric field increases from 0 to 2 kV/cm, the induced strain increases by 85 × 10
-6 (0.0085%). Overall, it can be seen that the change of ions inside the lattice is quite large, but the macroscopic distortion of the lattice is rather small.
When the applied electric field increases from 4 to 6 kV/cm, the displacement of Ti ions increases by 0.003 Å (0.14 Å–0.137 Å), which is about 0.075% compared to the lattice size. As the applied electric field increases from 4 to 6 kV/cm, the induced strain increases by 30 × 10-6 (160 × 10-6 – 130 × 10-6), which is 0.003%. It can be seen that as the magnitude of the applied electric field increases from 0 to 6 kV/cm, the movement of Ti ion decreases rapidly, but the strain of the lattice decreases relatively smoothly.
4 Summary and Conclusion
The dielectric and piezoelectric properties of the ferroelectric BaTiO3 were measured and analyzed using both strong and weak electric field conditions. The spontaneous polarization of BaTiO3 at room temperature was calculated as 17 μC/cm2 based on the lattice structure and internal ion location, which is in good agreement with the experimental results. The polarization and strain hysteresis curve according to the electric field were analyzed in terms of lattice structure and ion position. Dielectric permittivity coefficient ε33 could be calculated from the slope of P-E curve, which shows a good agreement with the dielectric constant measured with impedance analyzer. Piezoelectric coefficient d33 could be calculated from the slope of S-E curve. The magnitude of Pr is proportional to the offset distance of Ti4+ ion from the lattice center. The magnitude of εr (ε33/ε0) is believed to be proportional to the degree to which the Ti4+ ion can move freely within the lattice. The magnitude of d33 is believed to be proportional to how much Ti4+ ion distorts the lattice as it moves inside the lattice. It should be noted that the present analysis considers only the displacement of Ti ions within the lattice. Contributions from domain wall motion, which can significantly affect the polarization and strain behavior in ferroelectric BaTiO3, are not included in this model. Therefore, the quantitative agreement with experimental data may be limited.
Notes
-
Acknowledgement
None.
-
Conflict of Interest
The authors have no conflicts of interest to declare.
-
Author Contributions
Jae Hwan Park: Writing-Original Draft, Writing-Review & Editing.
Data Availability
Data available on request from the authors.
Fig. 1.(a) The ion positions in BaTiO3 lattice and (b) a P-E loop for an ideal ferroelectric
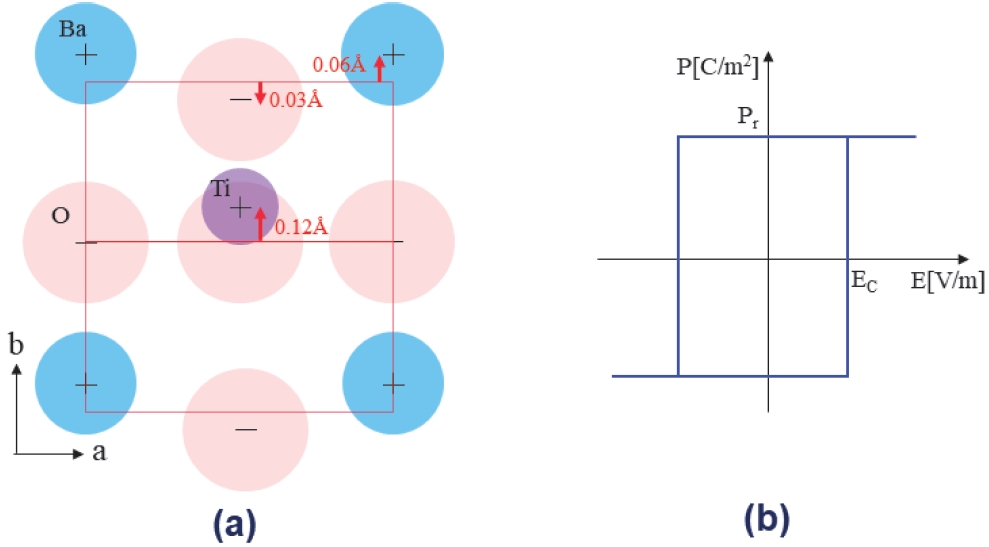
Fig. 2.(a) The ion positions in ferroelectric lattice according to electric field, (b) a typical P-E loop, and (c) S-E loop for ferroelectrics
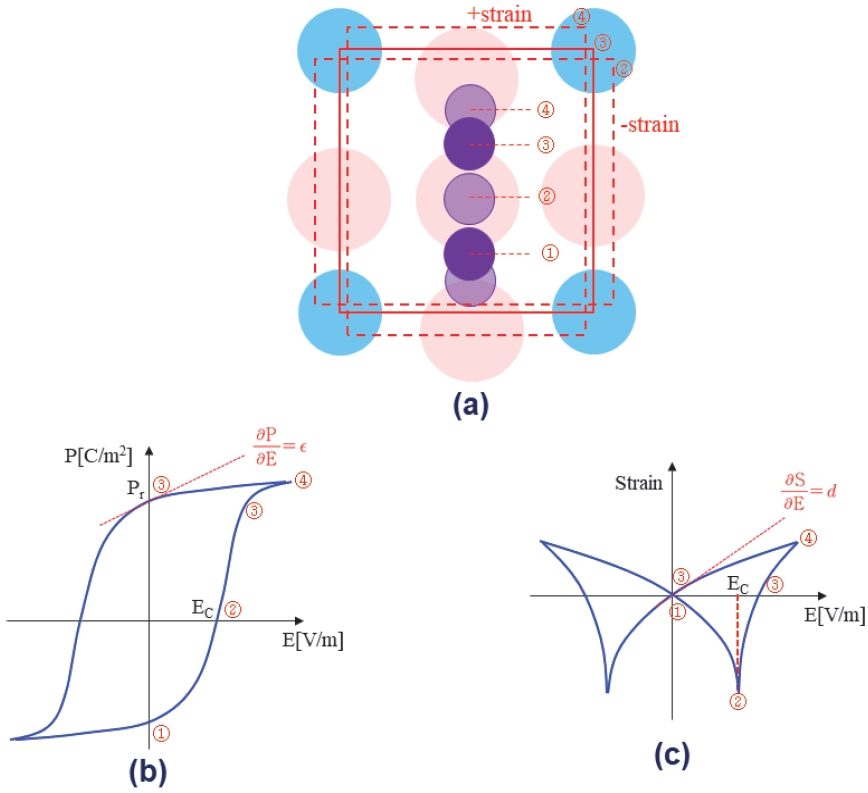
Fig. 3.Polarization and strain measurement system
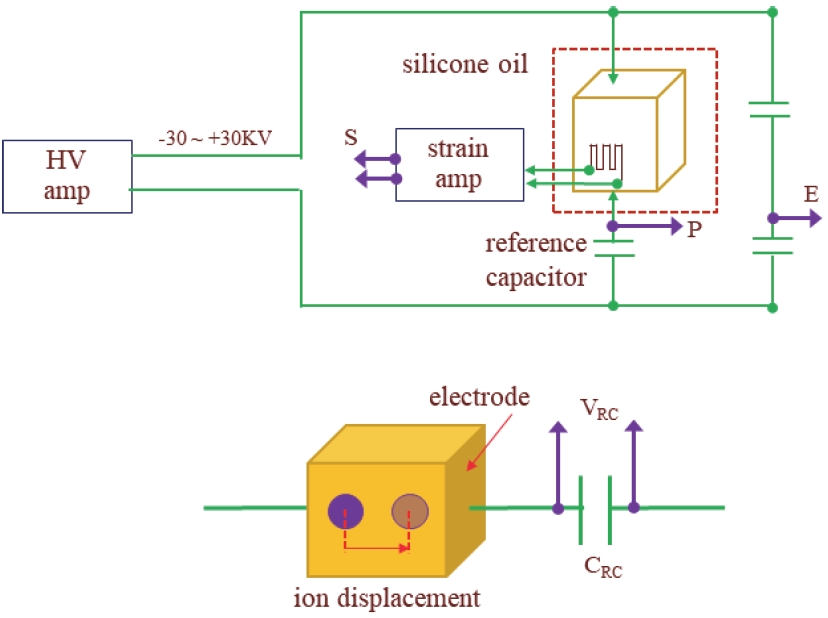
Fig. 4.The changes of the polarization and strain with electric field in BaTiO3 at selected temperatures
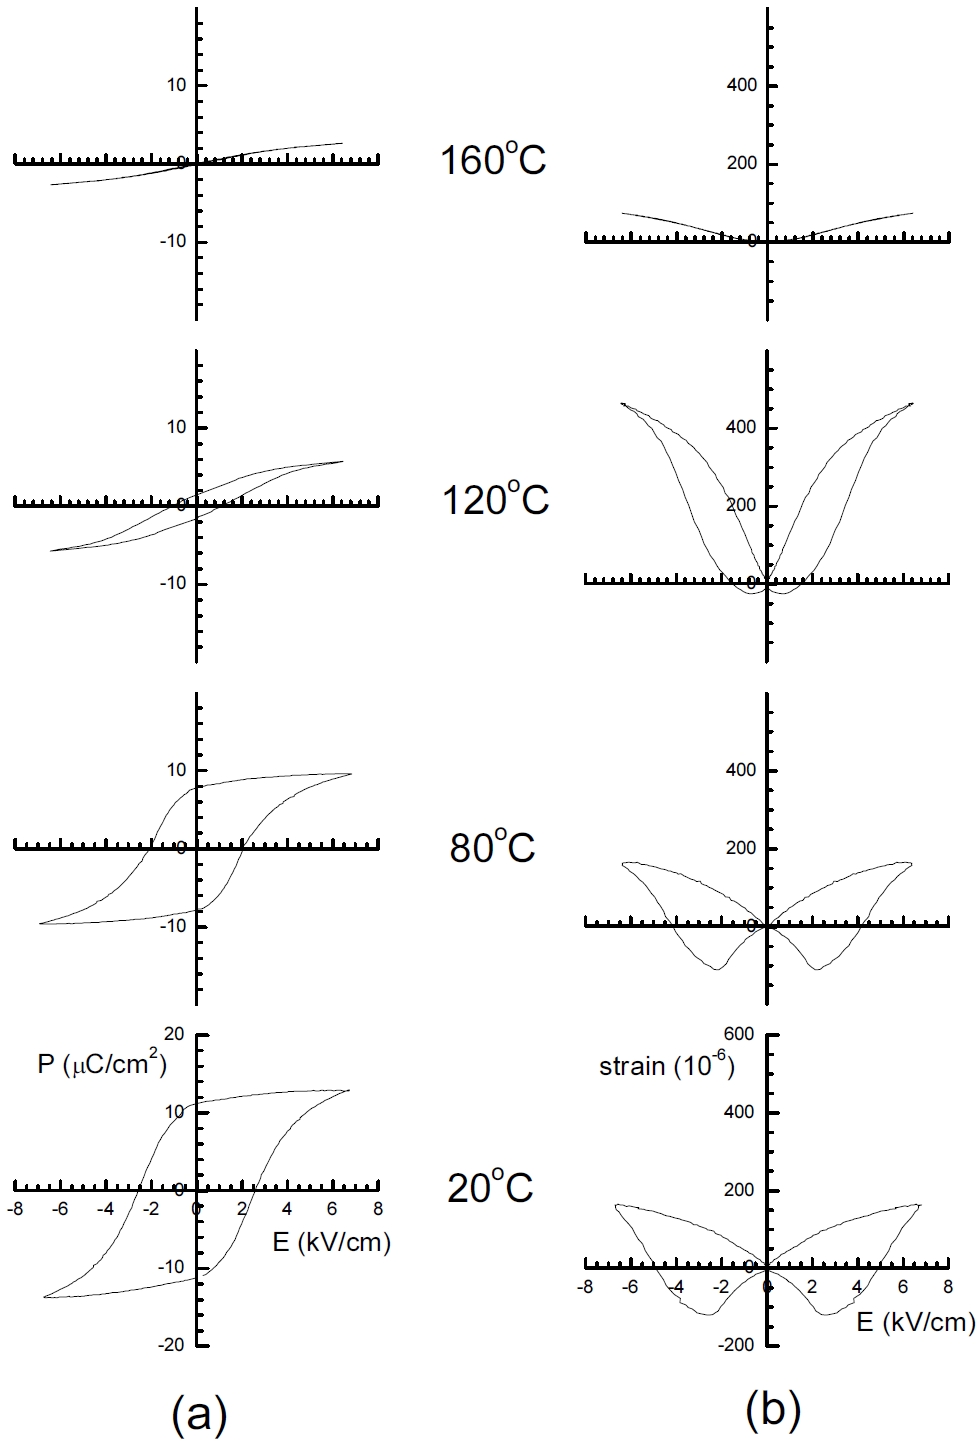
Fig. 5.The dielectric properties of BaTiO3 measured under the strong and weak electric field conditions
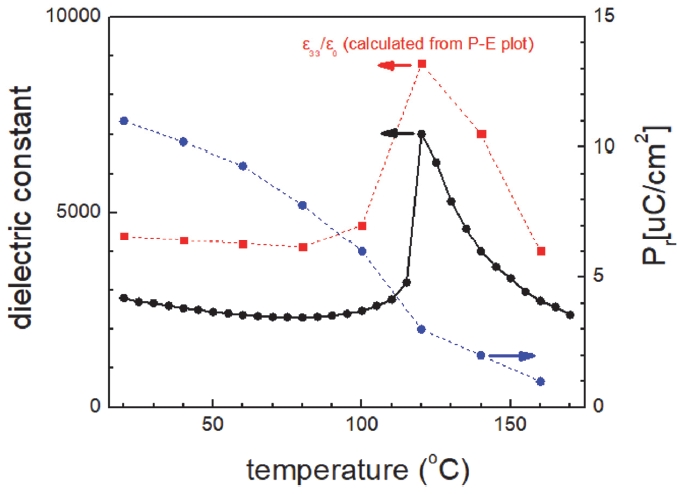
Fig. 6.The effect of applied electric field on (a) the calculated ε33 and d33 values, and (b) the ion movement in the lattice. Correlations between (c) the P-E loop and ε33 value, and (d) the S-E loop and d33 value
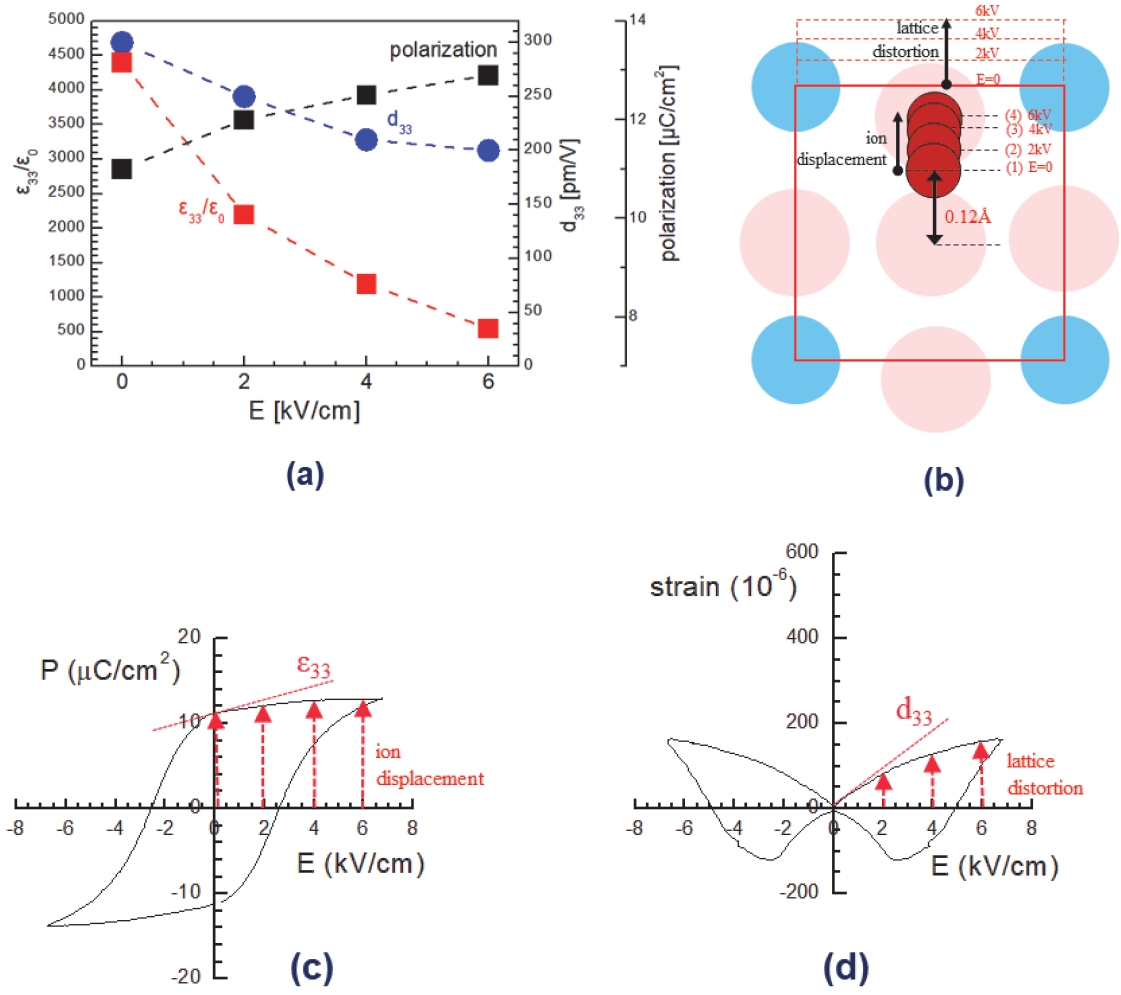
Table 1.Calculated spontaneous polarization in BaTiO3 based on the lattice model
Table 1.
|
Q [C] |
Position [m] |
P [Cm] |
|
Ba2+
|
2 × (1.6 × 10-19) |
+0.006 × 10⁻⁹
|
1.92 × 10⁻³⁰
|
|
Ti4+
|
4 × (1.6 × 10-19) |
+0.012 × 10⁻⁹
|
7.68 × 10⁻³⁰
|
|
2O2-
|
-4 × (1.6 × 10-19) |
0 |
0 |
|
O2-
|
-2 × (1.6 × 10-19) |
-0.003 × 10⁻⁹
|
0.96 × 10⁻³⁰
|
|
Induced polarization [Cm] |
1.056 × 10⁻²⁹
|
|
Cell volume [m3] |
6.38 × 10⁻²⁹
|
|
Ps [μC/cm2] |
17 |
Table 2.The effect of applied electric field on the piezoelectric and dielectric properties of BaTiO3
Table 2.
|
Applied electric field [kV/cm]
|
|
0 |
2 |
4 |
6 |
|
Induced polarization [μC/cm2] |
11.0 |
12.0 |
12.5 |
12.9 |
|
Estimated position of Ti4+ [Å] |
0.12 |
0.13 |
0.137 |
0.14 |
|
Induced strain [10-6] |
0 |
85 |
130 |
160 |
|
ε33/ε0
|
4,500 |
2,200 |
1,200 |
500 |
|
d33 [10-12 m/V] |
300 |
250 |
210 |
200 |
References
- 1. H. Jaffe and D. A. Berlincourt, Proc. IEEE, 53, 1372 (1965). doi: https://doi.org/10.1109/PROC.1965.4253
- 2. B. Jaffe, W. R. Cook Jr,, and H. Jaffe, Piezoelectric Ceramics, (Academic Press, London, 1971)
- 3. K. Uchino, Ferroelectric Devices, (Marcel Dekker, New York, 2000)
- 4. C. H. Lee, J. K. Lee, and J. R. Yoon, J. Korean Inst. Electr. Electron. Mater. Eng., 39, 175 (2026). doi: https://doi.org/10.4313/JEEM.2026.39.2.6
- 5. Y. S. Choi, Y. G. Kim, and S. G. Lee, J. Korean Inst. Electr. Electron. Mater. Eng., 38, 431 (2025). doi: https://doi.org/10.4313/JKEM.2025.38.4.12
- 6. A. Gaur, V. S. Chauhan, and R. Vaish, Surf. Interfaces, 36, 102497 (2023). doi: https://doi.org/10.1016/j.surfin.2022.102497
- 7. J. Zhang, H. Hao, Q. Guo, Z. Yao, M. Cao, and H. Liu, Ceram. Int., 49, 24941 (2023). doi: https://doi.org/10.1016/j.ceramint.2023.05.023
- 8. N. Yacout, H. S. Refai, M. A. Kebede, F. Salman, and E. Sheha, Mater. Chem. Phys., 292, 126770 (2022). doi: https://doi.org/10.1016/j.matchemphys.2022.126770
- 9. H. I. Hsiang, Y. H. Yang, C. Y. Huang, and K. H. Yang, Ceram. Int., 49, 28751 (2023). doi: https://doi.org/10.1016/j.ceramint.2023.06.134
- 10. J. H. Park, J. Microelectron. Packag. Soc., 30, 51 (2023). doi: https://doi.org/10.6117/kmeps.2023.30.3.051
- 11. J. H. Cho, C. J. Jeon, K. T. Lee, J. S. Park, Y. H. Jeong, and J. S. Yun, Ceram. Int., 41, 4789 (2015). doi: https://doi.org/10.1016/j.ceramint.2014.12.032